
The British fibre rollout is, by the numbers, nearly done in most places: a typical English or Welsh town has gigabit-capable broadband available to 94.9% of its homes.
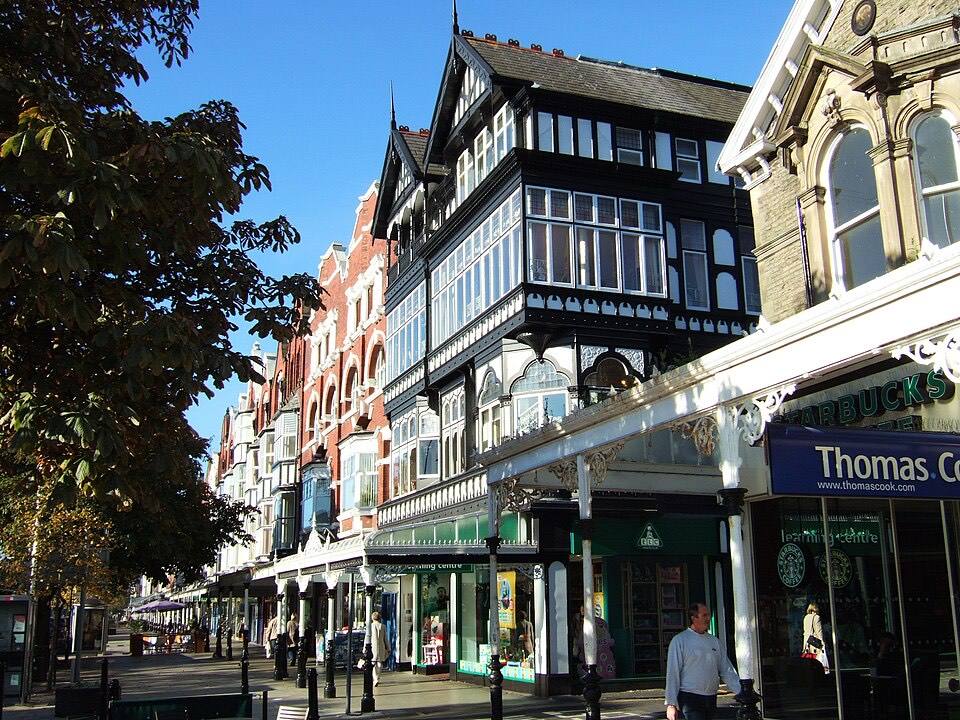
Then there is Southport, where 48.2% of 44,959 homes cannot order a gigabit connection at any price.
This piece is about the towns at the bottom of that distribution, because when the median sits in the mid-nineties the story stops being who leads and becomes who got left.
Lowest gigabit availability, towns of 20,000+
| # | Town | Gigabit | Superfast | Homes |
|---|---|---|---|---|
| 1 | Southport | 51.8% | 99.1% | 44,959 |
| 2 | Rayleigh | 58.0% | 99.5% | 14,339 |
| 3 | Newquay | 59.0% | 93.8% | 12,507 |
| 4 | Hailsham | 67.0% | 99.1% | 10,384 |
| 5 | Thetford | 69.6% | 99.6% | 10,715 |
| 6 | Camborne | 72.3% | 94.4% | 9,327 |
| 7 | Rustington | 74.5% | 99.1% | 17,153 |
| 8 | Berkhamsted | 74.7% | 99.1% | 9,372 |
The data says where; it cannot say why, and we will not guess on a per-town basis. What the pattern shows is that the laggards are rarely remote: Southport is a large seaside town twenty minutes from Liverpool, Rayleigh is Essex commuter belt. Build order is a commercial decision made street by street, and these towns are simply late in somebody's queue. Whether they stay late is the number to watch when Ofcom's next release lands.
The town that finished first
Kingston upon Hull reads 100%, and it is the least surprising perfect score in the dataset. Hull's phone network was never Openreach: the city council built its own in 1902 and its successor, KCOM, finished a citywide full-fibre rollout in 2019, years before the national build got serious. For most of a century Hull's cream-coloured phone boxes were a curiosity. For the last few years its residents have had the best-connected ordinary streets in Britain.
Hull is also the useful control: it shows what done looks like, which makes the gap between Southport's 51.8% and done a measurable thing rather than a complaint.
The homes below the floor
Gigabit is the ceiling. The floor is 10 Mbit/s, roughly the level of the universal service obligation, and across our measured towns 31,685 homes were below it at the July 2025 network snapshot. That number lives on each town's page rather than in this article's tone: for most towns it is a rounding error, and for a few it is a street-by-street problem the averages hide.
One refusal, carried over from the broadband league table: no average speed column, here or anywhere on this site. Ofcom's speed file reports averages per speed band without saying how many lines sit in each band, so no honest town-level speed figure can be built from it. Availability aggregates cleanly; speed would be an invention wearing a decimal point.
Source: Ofcom Connected Nations premises-level coverage (residential premises, network state July 2025), summed from census output areas to ONS built-up areas. Availability throughout: what the network can deliver, never take-up. Every town of 10,000+ residents carries its own figures on its page; the full league table has both ends.