Ask how big a town is and you will get a different answer depending on which line someone drew round it.
There are three common lines, and confusing them is the single biggest source of error in population data.
The three geographies
The local authority. An administrative boundary, drawn for the purpose of running things. It has a council, a budget and elections. It very often includes countryside and neighbouring villages that nobody would describe as part of the town.
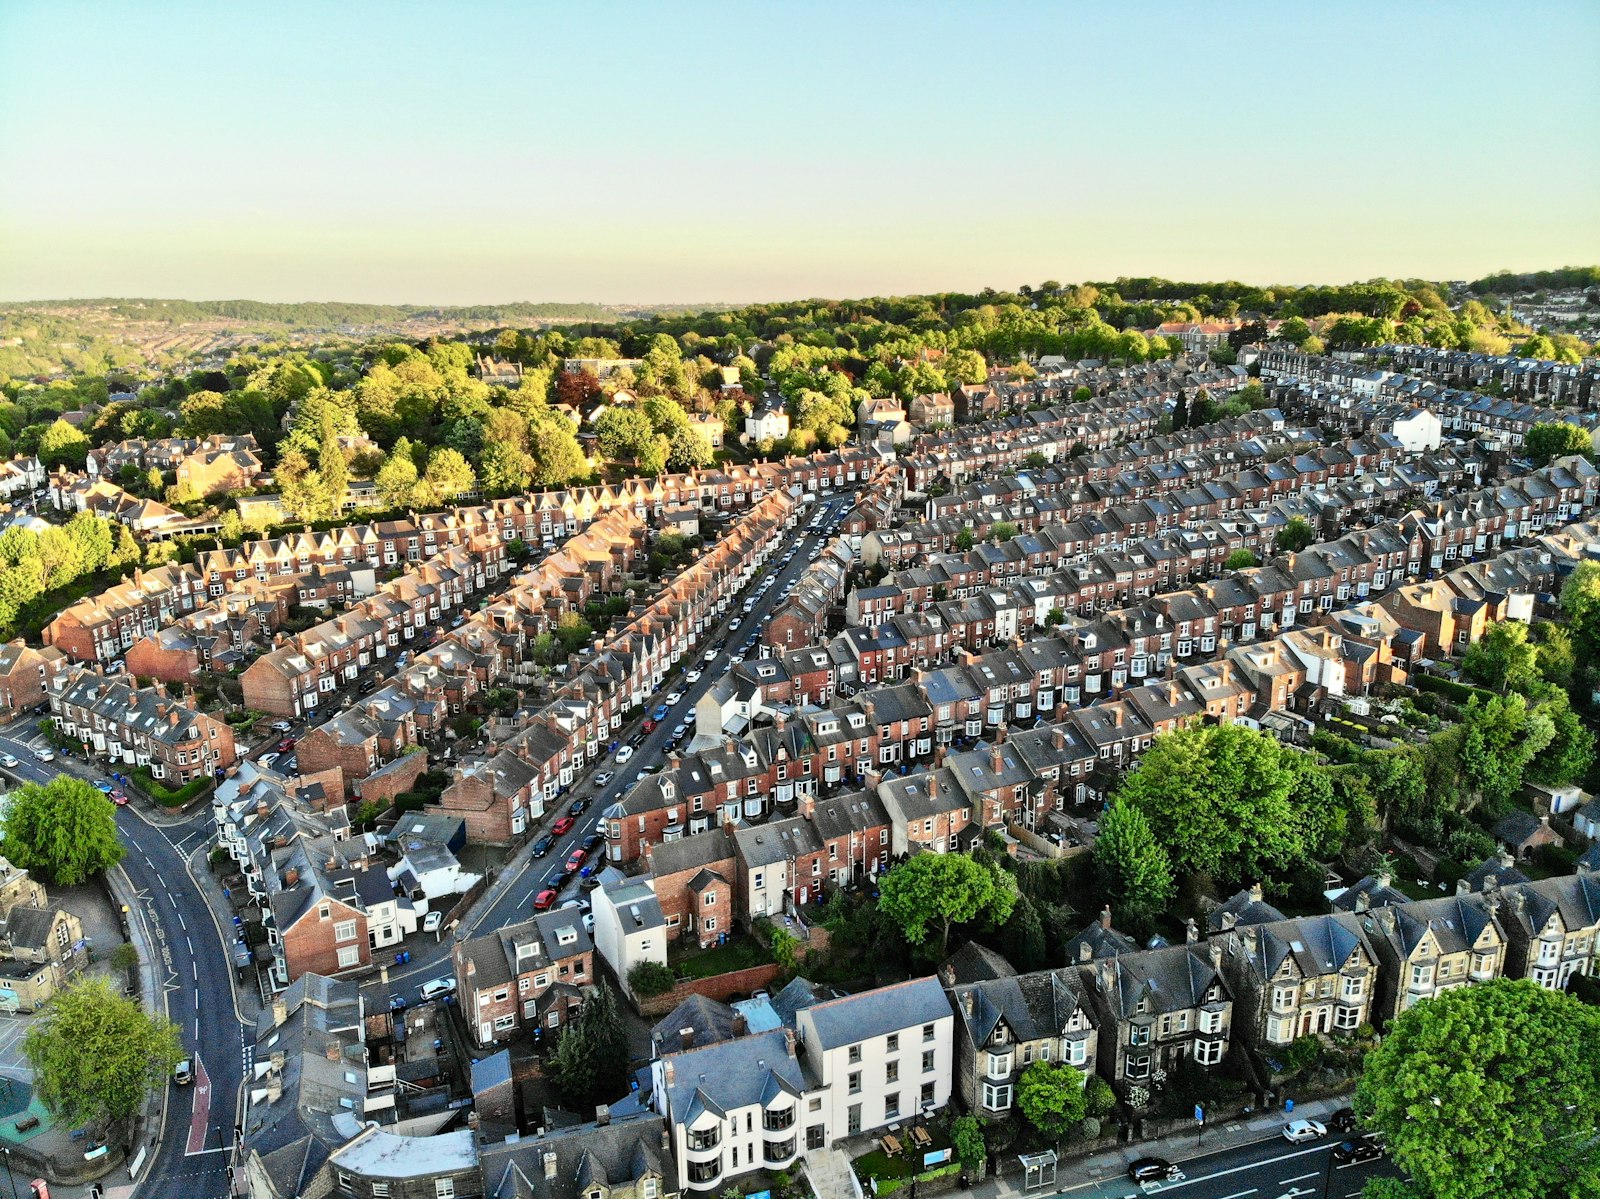
The built-up area. A physical boundary, drawn from where the buildings actually are. ONS builds these from Ordnance Survey topographic data, marking land as irreversibly urban where buildings sit generally less than 200 metres apart. Parks, gardens, isolated houses and industrial complexes are excluded.
The settlement or "place". The everyday sense of a town, which usually sits somewhere between the other two and has no single official definition at all.
Why this causes so much trouble
Take Bolton. The local authority covers Bolton, Farnworth, Horwich, Westhoughton and a good deal of moorland. The built-up area covers the continuous urban sprawl, which merges into Bury and Salford at the edges. The town, as anyone from Bolton would use the word, is smaller than both.
All three are legitimate answers to "how many people live in Bolton". They differ by tens of thousands.
Now multiply that by every town in a comparison table, where each row may have been sourced from a different place, and you have most published population rankings.
Where the built-up area breaks down
The physical approach has a limit, and it shows up in conurbations. When towns grow into each other, the buildings never thin out enough to separate them, so the method sees one enormous blob where residents see a dozen distinct places.
The Manchester-Liverpool corridor is the clearest English example. Our own density map shows it as a single continuous mass, because at that resolution it is one.
London breaks it entirely. ONS could not identify individual settlements within Greater London using the standard method, so it reports London by borough instead and removed London's 33 built-up areas from its main analysis. The capital did not fit its own country's geography.
What we do about it
We state which geography every figure uses, and we refuse to compare figures across geographies as though they were the same thing.
That is why our largest towns page explains that Birkenhead's figure covers much of the Wirral's urban footprint, and why place pages carrying a 2005 comparison suppress the change where the two sources drew the boundary differently. On 58 of those pages, the "growth" was entirely a boundary artefact: Preston appeared to grow 64%, Swansea 76%. Neither did.
It is less satisfying than printing a single confident number. It is also the difference between data you can cite and data you cannot.
A rule of thumb
If you are comparing places, use the same geography for all of them and say which. If you are quoting one place, use whichever fits your question and say which. The saying-which is the part that matters.
See how this plays out in practice: how many people live in London has four correct answers, and they differ by more than nine million.