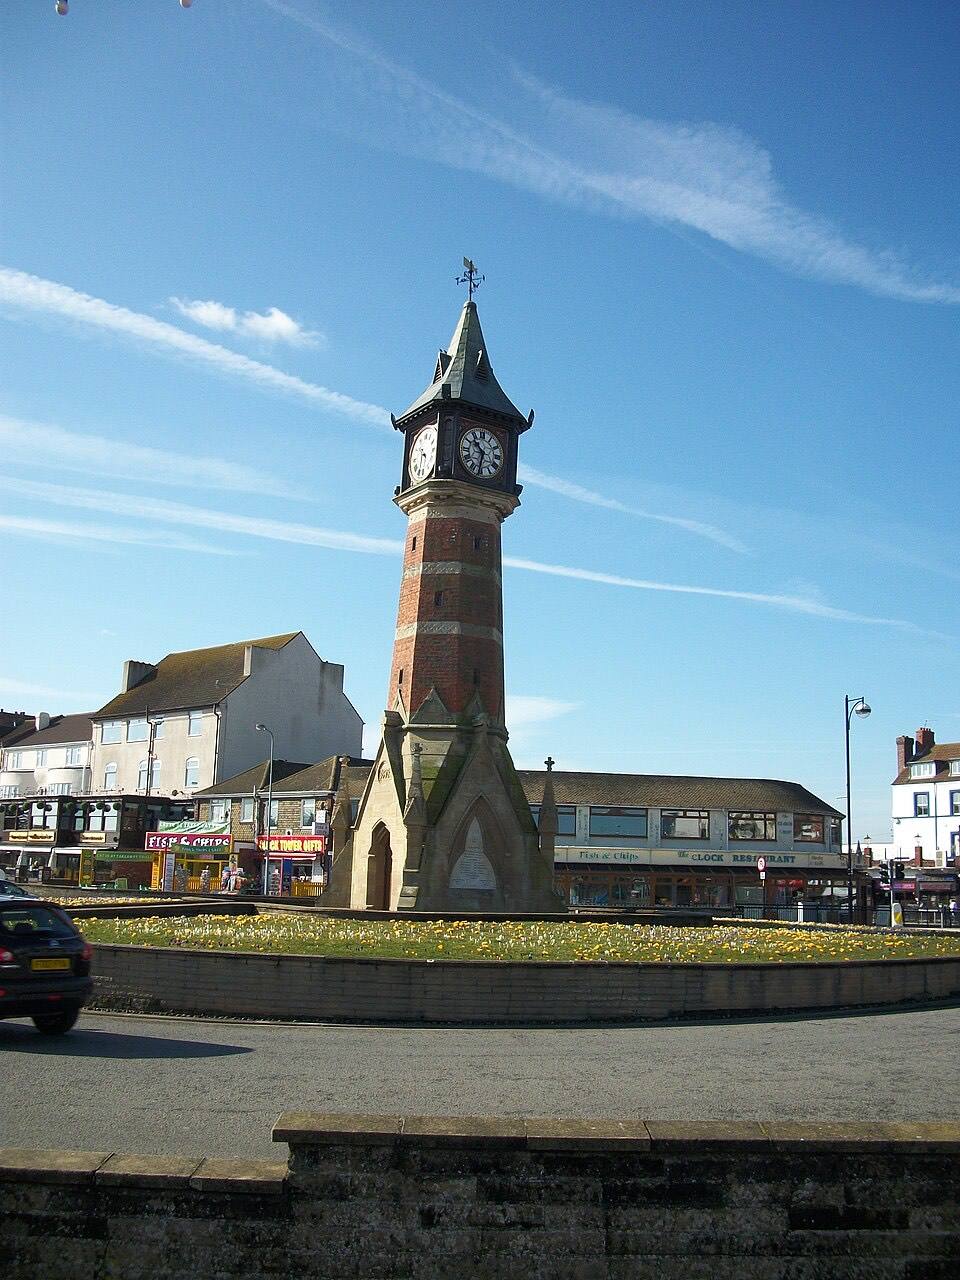

Skegness records 218.6 offences per 1,000 residents a year, a higher rate than 99% of English and Welsh towns and the 3rd highest of any town over 20,000 people.
The headline number is doing something sneaky, and one row of Skegness's own table catches it in the act.
The tell in the table
| Category | Rate per 1,000 | Higher than |
|---|---|---|
| Violence and sexual offences | 76.6 | 99% of towns |
| Anti-social behaviour | 43.0 | 99% of towns |
| Shoplifting | 31.6 | 99% of towns |
| Criminal damage and arson | 15.7 | 97% of towns |
| Burglary | 5.3 | 92% of towns |
| Vehicle crime | 3.6 | 57% of towns |
Look at vehicle crime: 3.6 per 1,000, the 50th percentile, as ordinary as a town can be. Now look at shoplifting (31.6, higher than 99% of towns) and anti-social behaviour (43.0, also 99th).
Vehicle crime happens to residents: their cars, their driveways, their streets. Shoplifting and anti-social behaviour happen where crowds are. If Skegness were simply a lawless town, all three would be high together. Instead the categories that track residents are average and the categories that track footfall are extreme, which is the signature of a different phenomenon entirely: a small town processing a very large number of people who are not in the denominator.
The arithmetic
A crime rate is offences divided by residents. Skegness has 20,700 census residents and one of the busiest seafronts in Britain: on a summer Saturday the people in town outnumber the people of the town many times over. Every incident they generate lands on the numerator. None of them appears in the denominator. The rate that comes out is real, correctly calculated, and describes the town centre's workload rather than anyone's odds of being burgled.
The same arithmetic runs through the whole crime league table. Its top end is a list of resorts and shopping towns, and the quiet end is the trustworthy end, because nothing inflates a low number: a town cannot fake the absence of incidents.
Why we publish it anyway
The tempting fixes are all worse. Estimating a "true" visitor-adjusted population would mean inventing a denominator; an index weighting categories by seriousness would mean deciding how many shopliftings equal a burglary, which is an opinion in a lab coat. So every crime figure on this site is a plain rate with its resident denominator stated, its categories separated, and this caveat attached where it matters.
What we ask of a reader is one habit: when a rate looks extreme, read the categories before the total. Skegness's table, read that way, describes a seaside resort in August. Read only as a headline, it describes a town that does not exist.
Figures are police-recorded crime (August 2025 to July 2026) located to the Skegness built-up area, per 1,000 residents at the 2021 census; percentiles compare English and Welsh towns of 10,000+ residents. Recorded crime measures reports, and reporting itself varies by place and category. Skegness's own page carries its full table alongside its prices, age profile and high street, and every other town's page does the same.