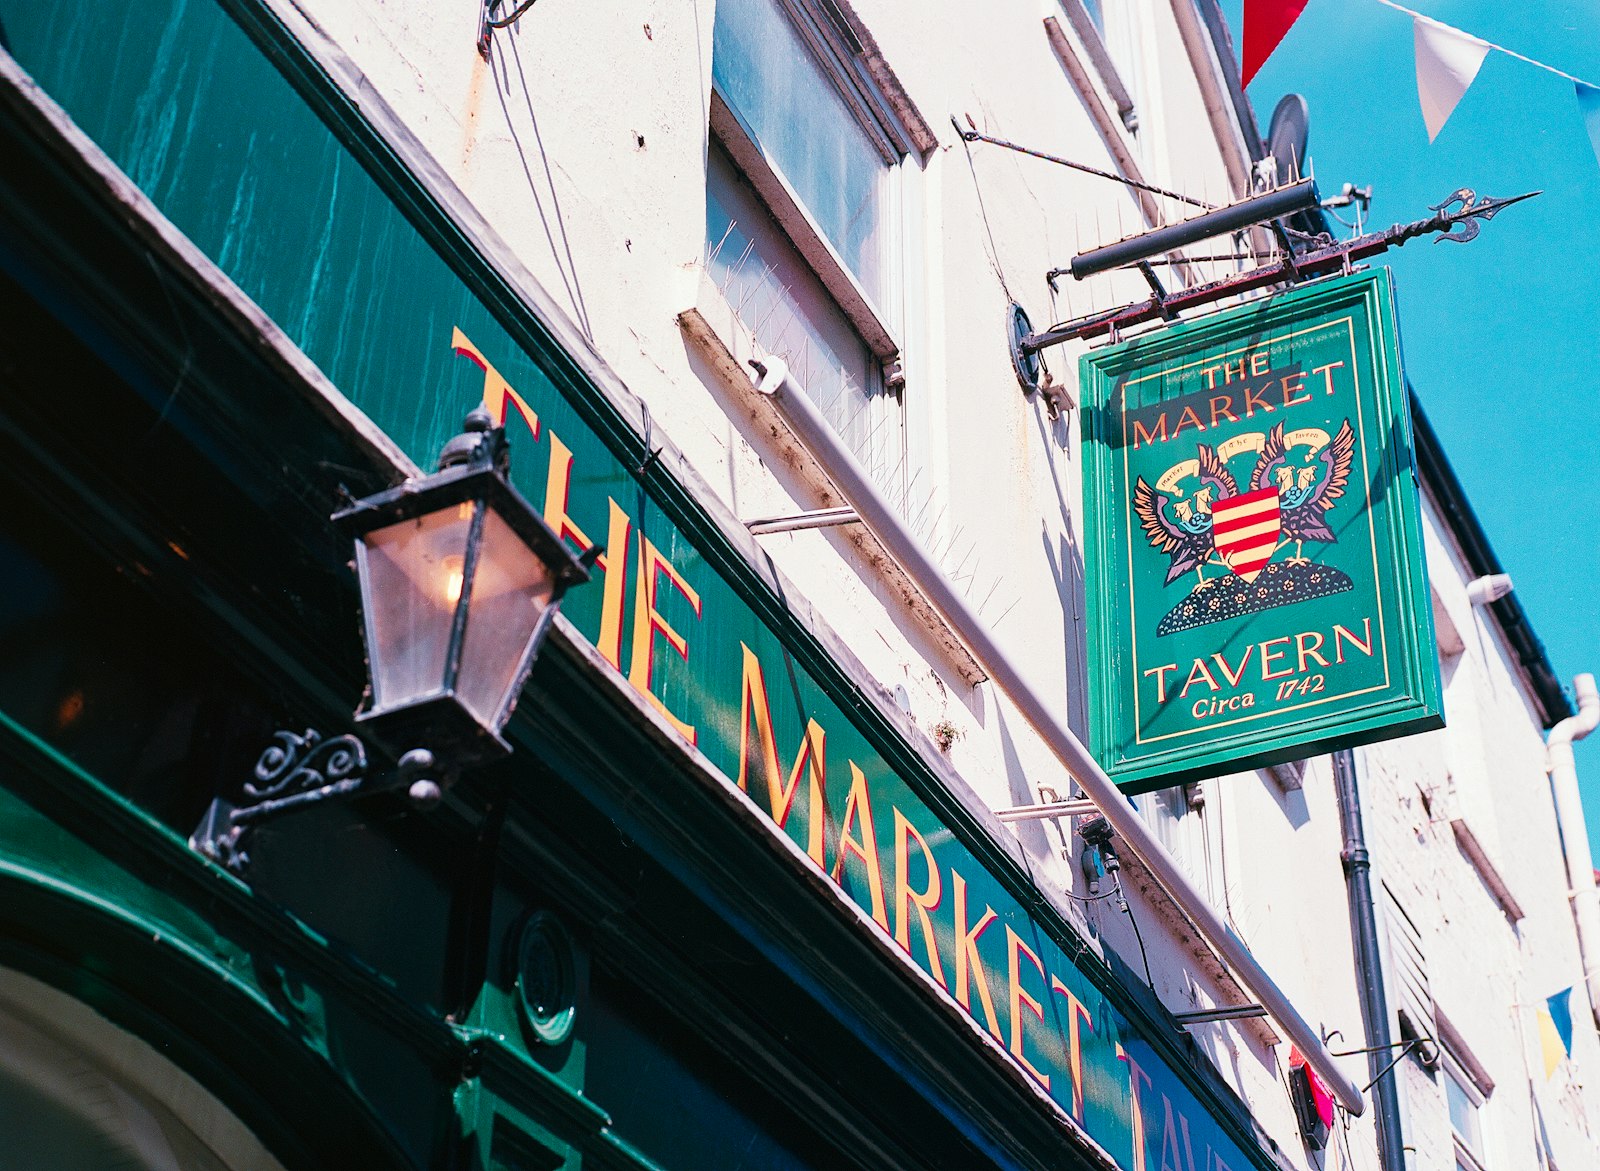
Britain has lost a lot of pubs. The British Beer and Pub Association counts 16,150 closures since 2000, from a base of 60,800. More than a third of the estate, gone in a generation.
What that figure cannot tell you is where the survivors are. So we counted them.
35,117 pubs, unevenly spread
Every pub in England is on the Food Standards Agency's register, because registering is a legal requirement for anywhere serving food or drink. That makes it a full count rather than a survey.
| District | Pubs & bars | Population | Per 10,000 |
|---|---|---|---|
| Derbyshire Dales | 160 | 71,757 | 22.3 |
| East Lindsey | 285 | 145,183 | 19.6 |
| Ribble Valley | 110 | 65,794 | 16.7 |
| Cotswold | 138 | 91,661 | 15.1 |
| North Warwickshire | 100 | 67,117 | 14.9 |
| Torridge | 101 | 69,841 | 14.5 |
| Newham | 63 | 374,523 | 1.7 |
| Slough | 27 | 167,359 | 1.6 |
| Barking and Dagenham | 27 | 232,747 | 1.2 |
| Havering | 21 | 276,274 | 0.8 |
The gap between top and bottom is roughly twenty-fold per resident. That is not a subtle regional variation.
Rural districts win, and it is not close
The Derbyshire Dales, East Lindsey and the Ribble Valley lead because rural pub density is a function of geography rather than demand. Villages five miles apart each need their own pub, and a sparse population spread over a wide area produces a high count per head.
The Isles of Scilly are the extreme case: nine pubs for around 2,300 people. Nobody is going to the mainland for a pint.
Outer London has almost none
At the other end sit Havering, Barking and Dagenham and Slough, all under two pubs per 10,000 residents. Dense, populous, and comparatively dry.
Some of that is demographic: these are among the more diverse boroughs in the country, and pub-going is not universal. Some is economic, because London land is worth more as flats than as a function room. We can measure the counts; we cannot separate those causes, and would be guessing if we tried.
What this is and is not
This is a snapshot, taken from the register as it stood in July 2026. It cannot show change over time, because we hold one extract rather than a series. The BBPA and CAMRA track closures properly and their figures are the ones to cite for the trend, including the estimate that closures slowed to around 350 in 2025.
What we can add is the geography of what remains, at district level, for every district. The counts sit alongside takeaway and restaurant numbers for the same places, and the whole lot is a free download.