County of Flintshire · Wales
Mold population
10,058people · latest estimate

Mold has a population of 10,058, making it the 5th largest place in County of Flintshire. In 2005 the World Gazetteer recorded 9,995, a rise of 0.6% since.
The other populations of Mold
The same name covers more than one area, and each has its own figure.
| What you mean | Population | Source |
|---|---|---|
| The place itself The populated settlement, roughly the built-up core. |
10,058 | GeoNames |
| The built-up area Continuous development, where buildings sit less than 200m apart. Drawn from where the buildings are, not where the council boundary is. |
9,890 | ONS Census 2021 (2021) |
| The place in 2005 The same settlement twenty years earlier. |
9,995 | World Gazetteer (2005) |
Why these differ: which population figure is right? · compare with another place
Mold in context

Distances are straight-line from the settlement's recorded coordinates. The 10 km figure sums the recorded places within that radius, so it describes how built-up the surroundings are rather than people per square kilometre.
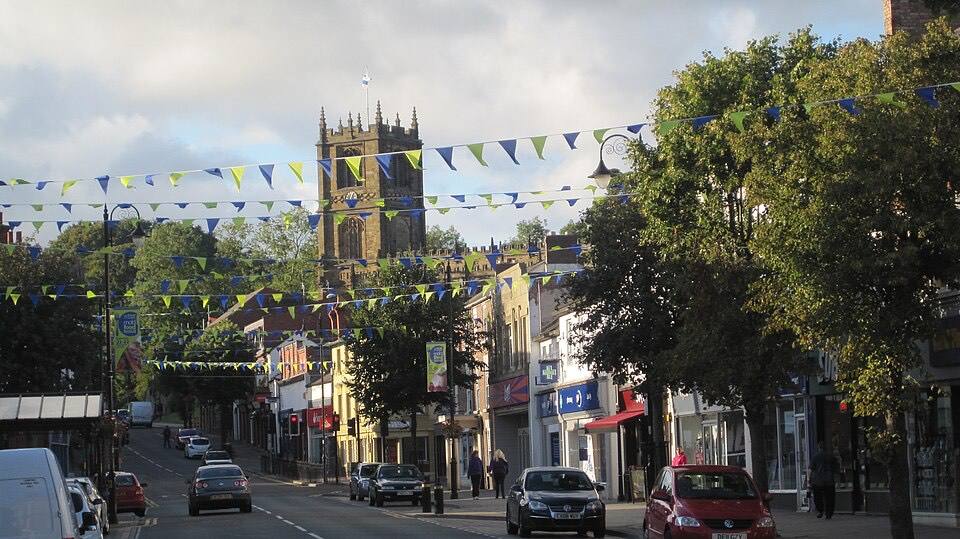
The centre of Mold sits in postcode district CH7.
Food and drink on the high street
| Registered premises | Count |
|---|---|
| Restaurants and cafés (33.4 per 10,000 residents) | 33 |
| Takeaways and sandwich shops (23.3 per 10,000 residents) | 23 |
| Pubs, bars and nightclubs (15.2 per 10,000 residents) | 15 |
| Supermarkets and hypermarkets (6.1 per 10,000 residents) | 6 |
Counts are registered food premises in the Mold built-up area (9,890 residents at the 2021 census), from the FSA food hygiene register, extracted 17 August 2026. The boundary is drawn from where the buildings are, so these figures cover the town itself rather than the wider council area, and no total is shown because the register also lists premises nobody would call a venue: school kitchens, care homes, warehouses. Compare towns →
Shops and services
| Premises | Count |
|---|---|
| Shops (all retail) (176.9 per 10,000 residents) | 175 |
| Cafés (11.1 per 10,000 residents) | 11 |
| Hairdressing salons (12.1 per 10,000 residents) | 12 |
| Banks and building societies (5.1 per 10,000 residents) | 5 |
| Post offices (6.1 per 10,000 residents) | 6 |
| Gyms (3.0 per 10,000 residents) | 3 |
| Leisure and sports centres (1.0 per 10,000 residents) | 1 |
| Surgeries (GP, dental and similar) (11.1 per 10,000 residents) | 11 |
| Libraries (1.0 per 10,000 residents) | 1 |
| Community centres (4.0 per 10,000 residents) | 4 |
| Car parks (6.1 per 10,000 residents) | 6 |
| Licensed betting shops (2.0 per 10,000 residents) | 2 |
Shops, cafés, salons, banks, post offices and arcades are rateable premises by use on the VOA 2023 rating list — the shops figure is all general retail, charity shops included. Gambling premises come from the Gambling Commission's licensing register, which lists 6,251 betting shops nationally against the rating list's 3,838: many betting shops are rated as ordinary shops, so the licensing register is the truer count and the one used here. Categories the rating list counts badly are deliberately absent rather than wrong: petrol stations disappear into supermarket ratings, vets and museums run far under their professional registers, and pools and nurseries mostly rate inside other premises. Same built-up-area boundary as the download table on this page.
Crime, per 1,000 residents
| Category (police-recorded, 12 months) | Rate | On the year |
|---|---|---|
| Violence and sexual offences | 48.9 | -13% |
| Anti-social behaviour | 25.5 | -13% |
| Shoplifting | 15.6 | +13% |
| Criminal damage and arson | 8.0 | -47% |
| Vehicle crime | 2.5 | – |
| Burglary | 3.5 | – |
| Other theft | 5.3 | -12% |
| All recorded offences | 124.7 | -13% |
The all-offences line is a count of records, not a safety score: it weighs every category equally, which is exactly why we publish the categories. We deliberately do not combine them into a single index.
The year column compares August 2025 to July 2026 with the twelve months before it, August 2024 to July 2025, two windows that do not overlap. A dash means that category had fewer than 50 offences in one of the years, where a percentage would be arithmetic rather than information. Read these as changes in what was recorded: a force changing how it logs a category, or a local campaign encouraging people to report, moves this column without anything changing on the street. The change is withheld entirely for any town whose force did not publish all twelve months in both years.
Figures are police-recorded crime (August 2025 to July 2026) located to this built-up area, per 1,000 residents at the 2021 census. Three cautions, each of which changes how a rate should be read: recorded crime is not crime experienced, because reporting rates differ by category and by place; the denominator counts residents, so town centres and visitor towns run high per resident precisely because many people there are not residents; and a high figure can reflect more reporting as easily as more crime. Percentiles compare towns of 10,000+ residents. Greater Manchester and Gloucestershire constabularies do not publish, so their towns show a note instead of a partial figure. Compare towns →
House prices
| Property type | Median sale price |
|---|---|
| Detached (56 sales) | £315,000 |
| Semi-detached (53 sales) | £212,000 |
| Terraced (27 sales) | £160,000 |
| All types (144 sales) | £220,000 |
| Change on the year before each type compared with itself, July 2024 to June 2025 | +2.3% |
Medians of actual registered sales in the Mold built-up area, July 2025 to June 2026, from HM Land Registry Price Paid data (standard open-market sales only; repossessions, part-value transfers and non-residential records excluded). A median is the middle sale, so it resists the mansion problem that skews averages. Recent sales take weeks to register, which is why the window ends before the current month. Types with fewer than 20 sales are not shown. The year-on-year change compares this window with the twelve months before it, July 2024 to June 2025, and compares each property type with itself before combining them on this year's mix. Doing it the obvious way instead, median against median, would have this town's prices swing on which kind of house happened to sell: one town in this data sold 29 detached houses one year and 9 the next, and its raw median halved without a single house changing price. The change is published only where the types compared cover most of the year's sales and the town saw 50+ of them. Compare towns →
Council tax
The area Band D council tax for Flintshire, the billing authority covering Mold, is £2,376 for 2026–27.
From the Welsh Government's council tax levels (Table 1): the overall average including police and community council elements, so it is the council's figure rather than the town's, and your own band depends on your property's 2003 valuation — Wales revalued in 2003 where England still uses 1991.
Schools
| Maintained schools in the built-up area | Count |
|---|---|
| Primary schools | 3 |
| Secondary schools | 2 |
From the Welsh Government's address list of schools (April 2026), located to this built-up area by postcode. Maintained schools only. No capacity or fill figures are shown: Wales publishes no per-school capacity file beside the address list, and the English pages' fill rates come from exactly such a file, so a Welsh version would be a guess.
Broadband
| Availability | % of homes |
|---|---|
| Gigabit-capable (1,000 Mbit/s+) | 91.9% |
| Superfast (30 Mbit/s+) | 99.5% |
Share of the 4,733 residential premises in this built-up area that the fixed network can serve at each speed, from Ofcom's Connected Nations coverage data (network state July 2025). Availability is what the line to a home can deliver if ordered, not what households actually subscribe to, and a full-fibre street where everyone bought the cheapest package shows 100% here. Percentile compares towns of 10,000+ residents. Compare towns →
Common questions
What is the population of Mold?
Go deeper
Towns like Mold
The closest statistical matches among English and Welsh towns of 10,000+ residents, with geography playing no part. Mold's own figures sit in the first row for comparison.
| Town | County | Median price | Offences /1,000 | Median age | Owner-occupied |
|---|---|---|---|---|---|
| Mold | County of Flintshire | £220,000 | 124.7 | 45.1 | 67.7% |
| Colwyn Bay | Conwy | £210,000 | 126.6 | 47.3 | 64.2% |
| Chesterfield | Derbyshire | £200,000 | 133.7 | 45.5 | 63.2% |
| Hartshill | Warwickshire | £225,000 | 131.0 | 46.1 | 74.0% |
| Lees | Borough of Oldham | £220,000 | — | 44.4 | 73.6% |
| Elland | Calderdale | £193,000 | 119.8 | 42.7 | 64.1% |
Matched on up to six measures — house prices, recorded crime, median age, owner-occupation, gigabit availability and professional occupations — each rank-normalised across the 773 towns that carry at least four of them. The likeness is mechanical, and the columns are here so you can judge it yourself.